Posts

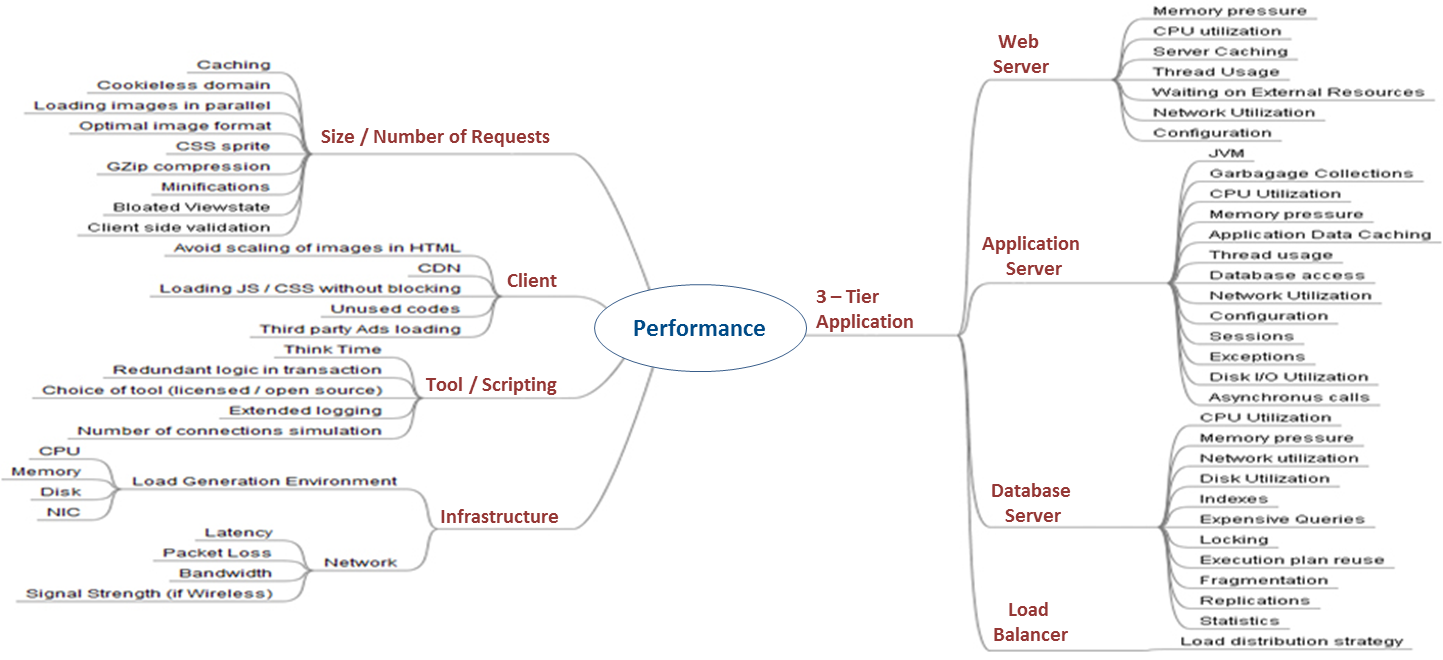
ASP.NET Application - What to Measure for Performance?

ASP.NET Application – What to Measure for Performance? Throughput »         What are number of requests getting executed per second? »         How many numbers of requests waiting to be executed? »         How many numbers of requests being rejected? ASP.NET Applications \ Requests / sec Web Service \ ISAPI Extension Requests / sec ASP.NET \ Requests Current ASP.NET Applications \ Requests Executing ASP.NET Applications \ Requests Timed Out Cost of Throughput »         What is the cost of throughput in term of processor utilization, memory, disk I/O and network utilization? »         What is the cost of hardware needed to achieve given level of performance? Processor Processor \ % Processor Time Processor \ % Privileged Time Processor \ % Interrupt Time System \ Processor Queue Length System \ Context Switches / sec Memory Memory \ Available Mbytes Memory \ Page Rea

ASP.NET Application Performance Considerations

ASP.NET Application Performance Considerations Threading Efficiency Thread pool tuning, Burst load, Creation of thread on per request, Blocking threads, Asynchronous calls Pool Resources Same connection string, Dispose or Close Call, Caching of pool resources, Obtain resource and release time ASP.NET Pages Page timeout, Page Size, Buffering, Page.IsPostBack, Partition Page Content, Expensive loops, Sever.Transfer instead of Response.Redirect Server Controls View State in Server Control, Deep hierarchies of Server Control Data Binding Page.DataBind, DataBinder.Eval Caching Dynamic data and static data, Memory limit, Caching right data, Refreshing cache, Cache API, Output Caching, Partial Page or Fragment Caching, Cache location, Kernel caching State Management InProc, StateServer,  SQL Server View State

Usage of Mind Map in Performance Engineering

Image
Mind maps can be fantastic tools to aid analyzing performance bottlenecks.  If done correctly, it not only help identifying bottlenecks faster but document analysis tips for rest of the team and for later usage.  Below mind map is an example of root cause analysis when page load time is observed to be high. Most of the time, when response time of a web request is found to be high, performance tester starts digging out the fault on server side.  It is not always true to have the issue lying at server side and on database server.  The issue can exist anywhere in the delivery chain.  I usually follow below order while identifying the issue of high response time. Step 1:  Issue with Tool / Scripts Before checking anywhere else, it is advisable to validate the scripts and tools being used for performance testing. »         Does high response time include think time unknowingly? »         Is there redundant logic (e.g. client side functionality) inside transaction for